Display Group Status
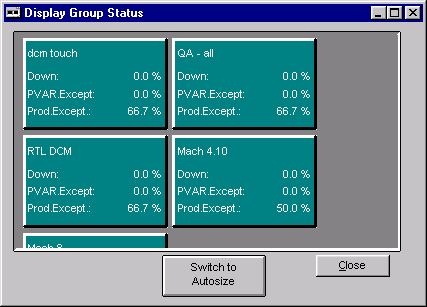
The Display Group Status window contains a rectangle for each defined display group. For each display group, the percent of machines in a down state, percent of machines in process exception, and the percent of machines in a production exception are calculated. Your system computes these percent values using current shift or job-to-date data or data collected during recent shifts. The color of the box reflects the display group's machine state. The machine with the highest priority state is reflected for the display group. See the Machine State Colors on-help section for further information.
Where can you find it?
| · | Choose the Monitor menu on the main your system window.
|
| · | Choose the Display Group Status option.
|
What do you want to know about?
| · | Toggling Auto Size and Normal Size
|
| · | Viewing Machine Status
|
| · | Closing the Window
|