Overlay Profile
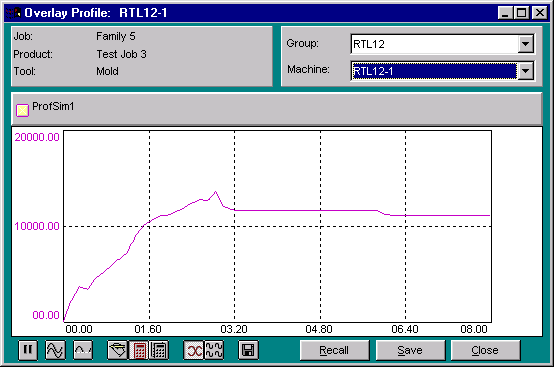
The Overlay Profile window displays the current behavior of a profile for a selected machine, overlays that profile on top of another profile, or crossplots the profile with another profile. It also allows you to zoom in on sections of a profile.
The window's graph area is blank until a profile is selected. Each profile is a collection of points. Each point represents a value that was collected during a machine cycle. Up to 500 points may be shown. Actual values are plotted against the Y-axis. The X-axis represents the time when the actual values were taken relative to the start time. The start time is always zero, which is the point at which the collection of the profile began.
NOTE: Each profile consumes a considerable amount of system resources. For that reason, only ten profiles may be displayed on the system at a given time.
Special graph controls are available for manipulating and tailoring the profiles:
 Freeze the profile
 Store the profile
 Clip the profile
 Manual scaling option
 Auto scale once option
 Auto scale every cycle option
 Overlay Selected Profiles
 Crossplot Selected Profiles
The color of the window background reflects the machine's running state. See the Machine State Colors on-line help section for further information. All profiles are plotted using the color code designated by the colored box to the left of each profile's name.
Where can you find it?
| · | Choose the Monitor menu on the main your system window.
|
| · | Choose the Overlay Profile option.
|
What do you want to know about?
General Functions:
| Changing Display Groups
|
| Changing Machines
|
| Selecting Profiles
|
| Exporting Data
|
| Closing the Window
|
Graph Functions:
| Clipping The Graph
|
| Freezing Profiles
|
| Changing Profile Graph Modes
|
| Changing Rescaling Options
|
| Storing Profiles
|
| Viewing Actual Values
|
| Viewing Maximum and Minimum Values
|
| Zooming Selected Profiles
|