Process Trend / SPC
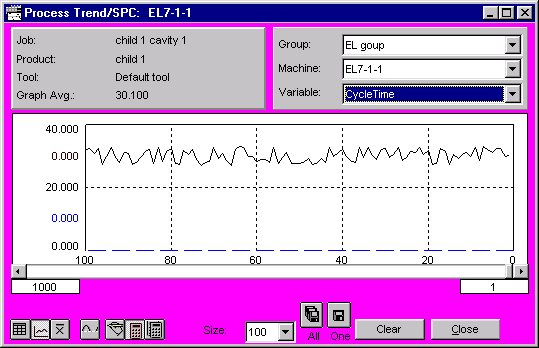
The Process Trend/SPC window graphically displays the behavior of any defined process variable for a machine. The selected number of most recent values for a variable are plotted.
Specific points to note are:
| · | The X-axis is the cycle number. The most recent cycle is 1.
|
| · | The Y-axis is the actual process variable value. The rightmost point is the most recent value. For each machine cycle update, the new value enters from the right, moving the older values to the left. Undefined values show up as blank spaces in the graph.
|
| · | The dashed, colored lines represent the higher limit and lower limit for the variable. The higher limit is red and the lower limit is blue.
|
The color of the window background reflects the machine's running state. See the Machine State Colors on-help section for further information.
Where can you find it?
| · | Choose the Monitor menu on the main your system window.
|
| · | Choose the Process Trend/SPC option.
|
The Process Trend/SPC window can also be accessed from the Process Summary window. While on the Process Summary window, click on a process variable's row of information. A trend graph appears for the selected process variable and machine.
What do you want to know about?
General Functions:
| SPC Statistics Concepts
|
| Changing Display Groups
|
| Changing Machines
|
| Selecting Process Variables
|
| Displaying Standard SPC Statistics
|
| Exporting Data
|
| Closing the Window
|
|
|
| Clipping the Graph
|
| Changing the X-axis
|
| Clearing Process History Information
|
| Changing Rescaling Options
|
| Viewing Actual Values
|
| Viewing Maximum and Minimum Values
|