Process Summary
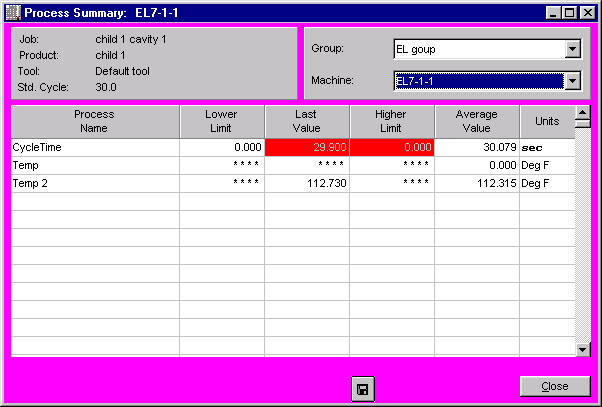
The Process Summary window displays the high value and low value for a machine's process variables measured during the last fifty complete machine cycles.
The Process Summary window provides quick access to the Process Trend/SPC window for a specified machine and process variable. To view a process trend graph, click on a process variable name or any place on its row of information. A trend graph appears for the selected process variable and machine.
If a process variable is above the higher limit or below the lower limit, that process variable is highlighted according to the following default color scheme:
| · | Red - value is above the higher limit
|
| · | Blue - value is below the lower limit
|
There is one line of information in the table for each process variable defined. The color of the window background reflects the machine's running state. See the Machine State Colors on-help section for further information.
Where can you find it?
| · | Choose the Monitor menu on the main your system window.
|
| · | Choose the Process Summary option.
|
What do you want to know about?
| · | Changing Display Groups
|
| · | Changing Machines
|
| · | Closing the Window
|