Process Summary
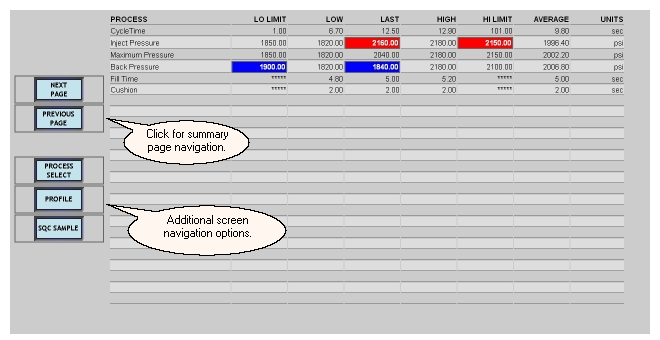
The Process Summary screens display information for a machine's process variables measured during the last fifty complete machine cycles. The table of values includes the low and high limits defined for the current job, the last value, the high value and low value, and the average value for each process variable defined. Up to twenty-five variables can be displayed per screen and navigation buttons are provided to scroll between summary screens.The Process Summary screen provides quick access to the Process Select, Profile, and SQC Sample screens for a specified machine by using the screen navigation buttons at the left side.
When a process variable reading is collected, it is compared to the process limits which have been defined for the job. If a process variable is above the higher limit or below the lower limit, that process variable is highlighted according to the following default color scheme:
| · | Red - value is above the higher limit
|
| · | Blue - value is below the lower limit
|
If a process variable is outside of its defined limits for the job, the machine will be put in the process exception state for that cycle which will be reflected in the lights frame.
Click the image below on any field for more detailed information.
What do you want to know about?
| · | Selecting a process variable to see more detailed information
|
| · | Displaying profile information
|
| · | Taking an SQC Sample
|