Process Table
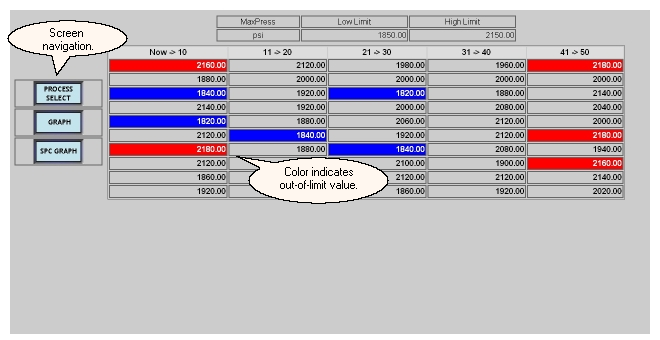
The Process Table screen details the history of a process variable over the last fifty machine cycles. The name, defined limits, and units of the variable are shown in the table heading. If a process variable is above the higher limit or below the lower limit defined for the job, that process variable value is highlighted in the table according to the following default color scheme:| · | Red - value is above the higher limit
|
| · | Blue - value is below the lower limit
|
If the last value of a process variable exceeds its defined limits for the job, the machine will be put in the process exception state for that cycle which will be reflected in the lights frame.
There are three screen navigation buttons on the left to navigate among the Process Screens. The Process Select button will return you to the selection screen. The Graph button provides the option to display the data in graphical form on the Process Graph screen. If SPC data is available, a navigation button will be shown to display the SPC graph.
Use the Lights Frame to return to the Process Summary screen.
What do you want to know about?
| · | Displaying the values as a graph
|
| · | Displaying an SPC graph for the variable information
|