Process Graph
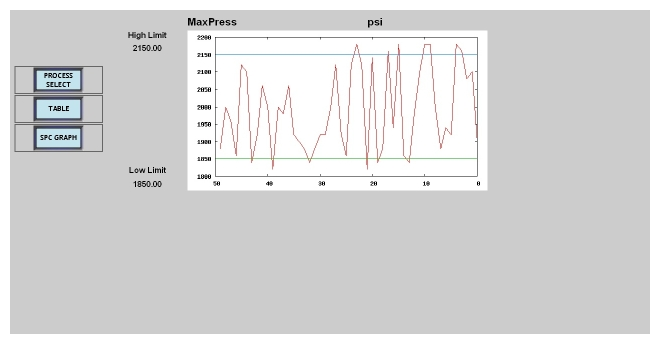
The Process Graph screen for a variable can be displayed by pressing the "GRAPH" button on the Process Table screen. The variable name and the units of measurement are displayed at the top of the graph. The high and low limits as defined for the job are indicated on the left side.The x-axis is the cycle number. The y-axis is the actual process variable value. The graph can display the last fifty values with the rightmost point being the most recent value. For each machine cycle update, the new value enters from the right and moves the older values to the left. An undefined value will be a blank space in the graph.
There are three screen navigation buttons to navigate among the Process Screens. This screen provides the option to display the data in graphical form on the Process Graph screen. If SPC data is available, a navigation button will be shown to display the SPC graph as shown in the screenshot. The Process Select button will return you to the selection screen.
There are three screen navigation buttons on the left to navigate among the Process Screens. The Process Select button will return you to the selection screen. The Table button provides the option to return to the data detail on the Process Table screen. If SPC data is available, the navigation button will be shown to display the SPC graph.
Use the Lights Frame to return to the Process Summary screen.