Process SPC
The Process SPC screen displays SPC data that is monitored by the DCMs. The standard SPC statistics are shown at the top of the screen. The top graph is a plot of X-bar values and the bottom is a plot of the associated range values. The X-axis is the time at which the SPC values were recorded.The Process SPC screen can only be selected from the Process Table screen for a process variable if SPC data is available.
There are three screen navigation buttons on the left to navigate among the Process Screens. The Process Select button will return you to the selection screen. The Table button provides the option to return to the data detail on the Process Table screen. The Graph button provides the option to display the data in graphical form on the Process Graph screen. Use the Lights Frame to return to the Process Summary screen.
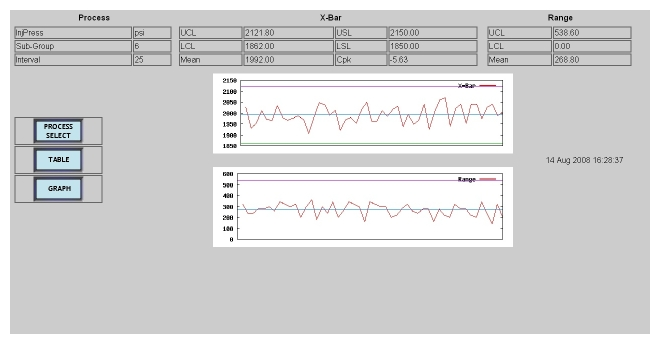
Alarms are displayed to the right of the graph. The key for the alarms is as follows:
XCL The last X-bar value was not within control limits
RCL The last Range values was not within control limits
INC The last 8 X-bar values were continuously increasing
DEC The last 8 X-bar values were continuously decreasing
ABV The last 8 X-bar values were above the mean
BLW The last 8 X-bar values were below the mean
UTR The last 25 X-bar values show an upward trend
DTR The last 25 X-bar values show a downward trend
RSM Within the last 25 X-bar values, a RUNSUM exceeded 4.
