Profile Cross
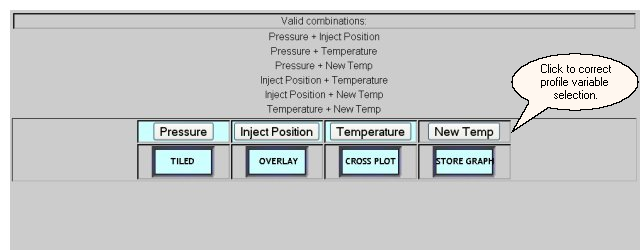
The Profile Cross screen graphically displays the values of machine's profile data. A profile is a set of up to 500 readings of a rapidly changing process variable, such as pressure or position, collected during one machine cycle. The cross plot displays two selected profiles for a machine on one graph. The profiles selected must have the same delay and period defined. The first variable is the x-axis value and the second variable is the y-axis value in the cross plot.If a valid combination of two profile variables has not been selected, the profile store screen will display the list of combinations from which to choose as shown below.
The Profile Tiled screen is the default profile screen that is displayed when the "PROFILE" button is selected on either the Process Summary or the Process Select screens. The Profile Cross screen can only be selected from another of the profile graph screens.
The area below the graphs provides additional option buttons for displaying profile information. One or more of the available profile variables can be selected/deselected for graphing by using the named buttons. In addition, the profile screens provide navigation buttons to display the four available graph formats:
| · | the profile tiled graph
|
| · | the profile overlay graph
|
| · | the profile cross plot graph
|
| · | the profile store graph
|

Pressure, inject position, and temperature were selected in this example. This is an error because only two profiles can be selected for the profile cross graph. The valid combinations are listed on the screen.
Use the Lights Frame to return to the Process Summary screen.